Learnings from Week 1 of MLDL show .
Disclaimer: Includes lots of machine learning Level 1 and MEMES.
Hello , Week 1 of The #MLDLS2021 is Completed and I will be sharing my learnings from it .

**Learnings from First Lecture**
- Intro to ML and it's sub branches
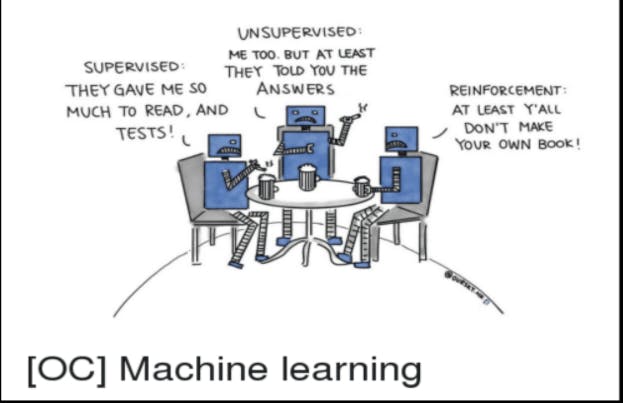
- Intro to ML algorithms: supervised, un- supervised, regression, classification with examples .
- We were divided into breakout rooms for discussing applications of ML .
- Every algorithm was explained well with examples like when should you use regression and when classification .
- Ex: For predicting rain(i.e. will it rain tomorrow or not) we will use classification and not regression.
- Ex: When you have data which seems to be divided into groups ,you will use clustering algorithm as it will divide the data into groups .
- A quiz on these topics(I scored a 10 (Hurray)) .
**Learnings of Second Lecture**
- Linear Regression :
- Simply, a graph line is plotted by the algorithm according to the x and y values provided.
- If there are multiple input variable (Price of house vs. area+rooms+color): Multiple Regression
- Loss functions:
- The difference of actual and predicted value in a graph and their average is the value of Loss function .
- The less loss value ,the better algorithm .
- If the loss value is higher try for searching another algorithm.
- The more data and training of model ,the better .
- Ideal training and testing of data should be 8:2 or 7:3 .
Important libraries for machine learning :
- Numpy : NumPy basically provides n-dimensional array object. NumPy also provides mathematical functions which can be used in many calculations.
- Code: import numpy as np
         arr = np.array([[1,2,3],[4,5,6]])
         print("Numpy array\n {}".format(arr))
Matplotlib : Matplotlib is scientific plotting library usually required to visualize data. Importantly visualization is required to analyze the data. You can plot histograms, scatter graphs, lines etc.(In sort for plotting graphs ) .
Code: import matplotlib.pyplot as plt
x = [1,2,3] y = [4,5,6] plt.scatter(x,y) plt.show()- Pandas : Pandas is used for data analysis it can take multi-dimensional arrays as input and produce charts/graphs.
- Code: import pandas as pd
age = {'age': [4, 6, 8, 34, 5, 30, 41] } dataframe = pd.DataFrame(age) print("all age:\n{}".format(dataframe)) filtered = dataframe[dataframe.age > 20] print("age above 20:\n{}".format(filtered)) - sklearn : Sklearn is used for creating the linear regression model Refer official doc : https://scikit-learn.org/stable/modules/generated/sklearn.linear_model.LinearRegression.html
- Dataset websites :
- Kaggle : kaggle.com
- Google data search : datasetsearch.research.google.com
- UCI machine learning : archive.ics.uci.edu/ml/index.php
- Platform for making a machine learning model :
- Google Colab: colab.research.google.com/?utm_source=scs-i..
- It gives you free to use GPU for better processing .
- A quiz for testing our knowledge( got 9 on 10) .
The best part about the presentation is that we get to see Machine learning memes after every topics ,and we love it .
Some memes for you too :
 Next step : FROM MLDL Show.
All thanks to our Awesome mentors : Rucha,Vedant and Harsh.
